MyMediaConnect: from operational collaboration to packaging performance steering
How Capamoon designed in two weeks the prototype of an analytical dashboard turning MyMediaConnect's ALM platform into a true tool for steering packaging performance.
2 weeks
Prototype delivered
Business validation and immediate client demonstration
5
Analytical views
Executive, Projects, Resources, Quality, Details
10+
Analysis axes
Dynamic filters combinable in real time
Spec-driven
Methodology
Functional specs, KPIs and data model before code
Context & challenges
MyMediaConnect supports companies — particularly in FMCG and pharma — in managing their packaging creation processes through a collaborative online platform.
The platform brings together every stakeholder involved in packaging creation — marketing, creative agencies, R&D teams, legal, prepress and printers, among others — to streamline workflows and reduce production lead times.
But beyond operational execution, MyMediaConnect's clients had a strategic need: a clear view of the actual performance of their processes.
The goal:
- identify delays and bottlenecks
- understand the root causes of slippage
- continuously improve packaging creation processes
- steer operations from concrete data
A strategic project for MyMediaConnect
For MyMediaConnect, this dashboard is not simply a new product feature.
It marks a shift of the platform towards a true tool for steering packaging performance.
Full prototype delivered in 2 weeks
Rapid validation of business use cases and immediate client demonstration.
Capamoon's response: a dashboard designed around real-world uses
Rather than building plain reporting, Capamoon structured the dashboard around the decisions users have to make every day.
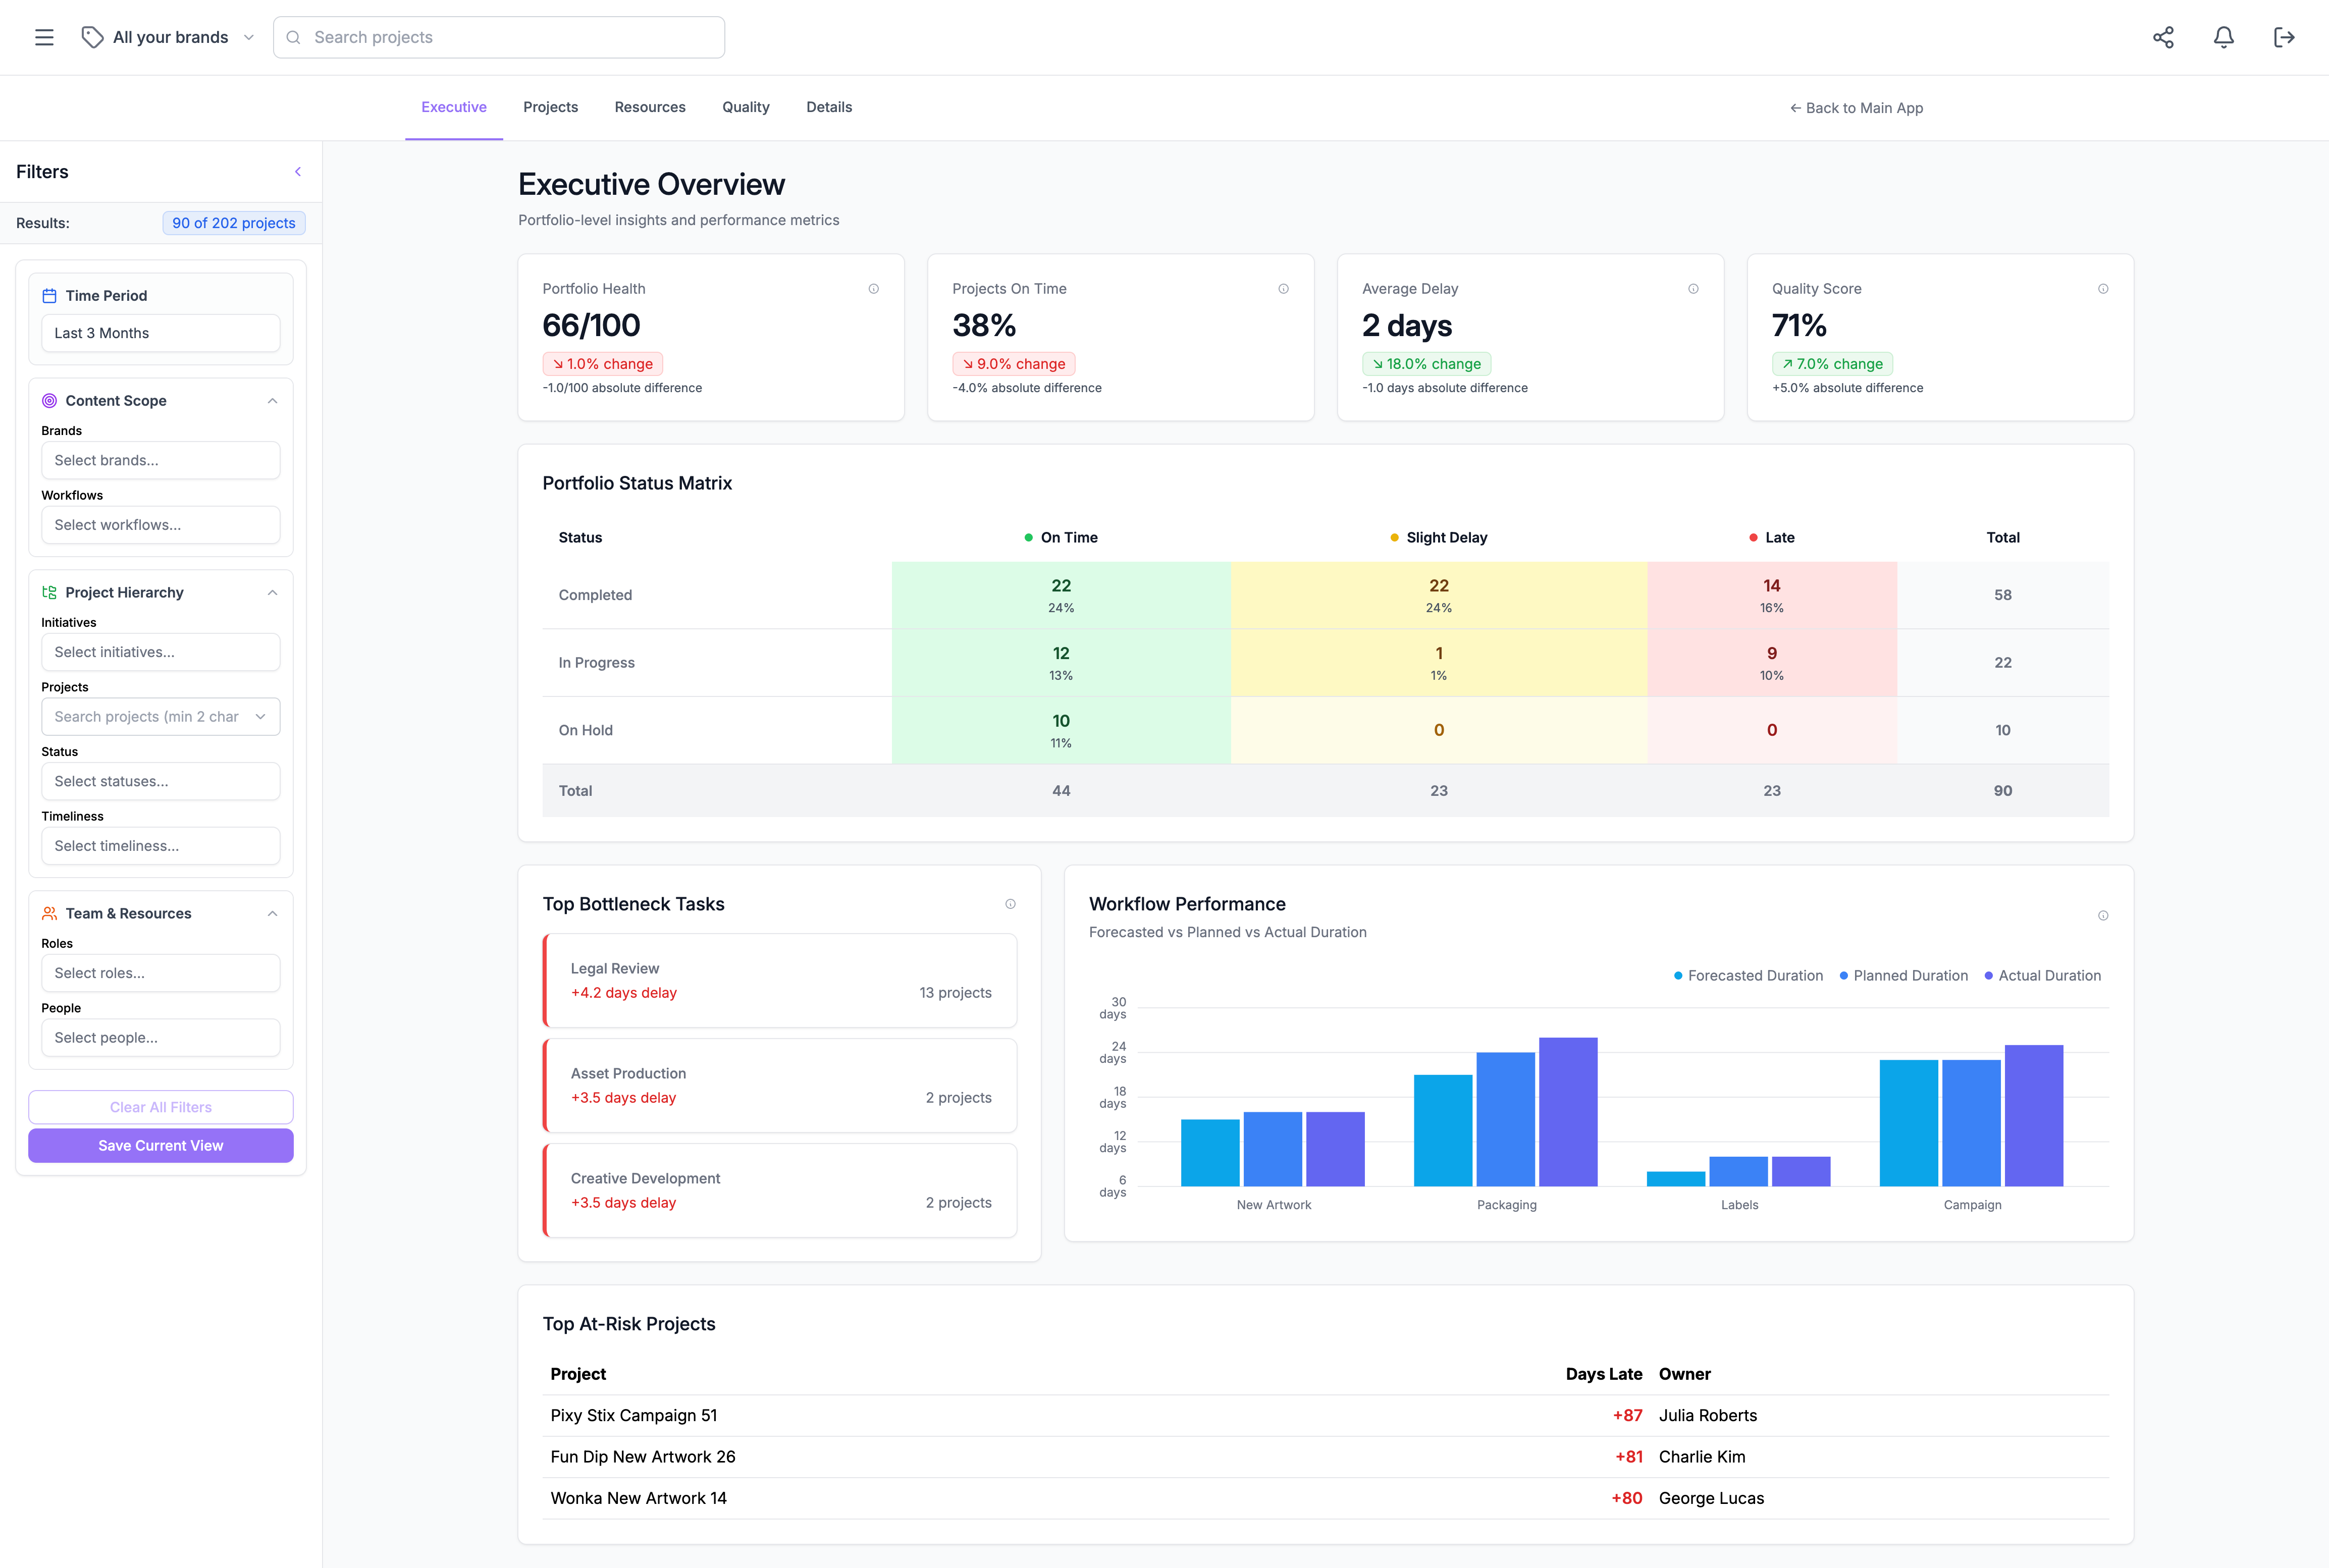
The dashboard is organised around five major analytical views.
Five analytical views
Executive Overview
A global view of the project portfolio: delays, on-time delivery and projects at risk.
Project Performance
Analysis of actual vs. planned durations to spot the stages that slip the most.
Resource Performance
Performance analysis by role or user to detect recurring friction points.
Quality & Risk
Tracking of rejects, versions, critical delays and overall workflow stability.
Details & Drill-down
Detailed project-by-project exploration with search, drill-down and exports.
A cross-analysis engine
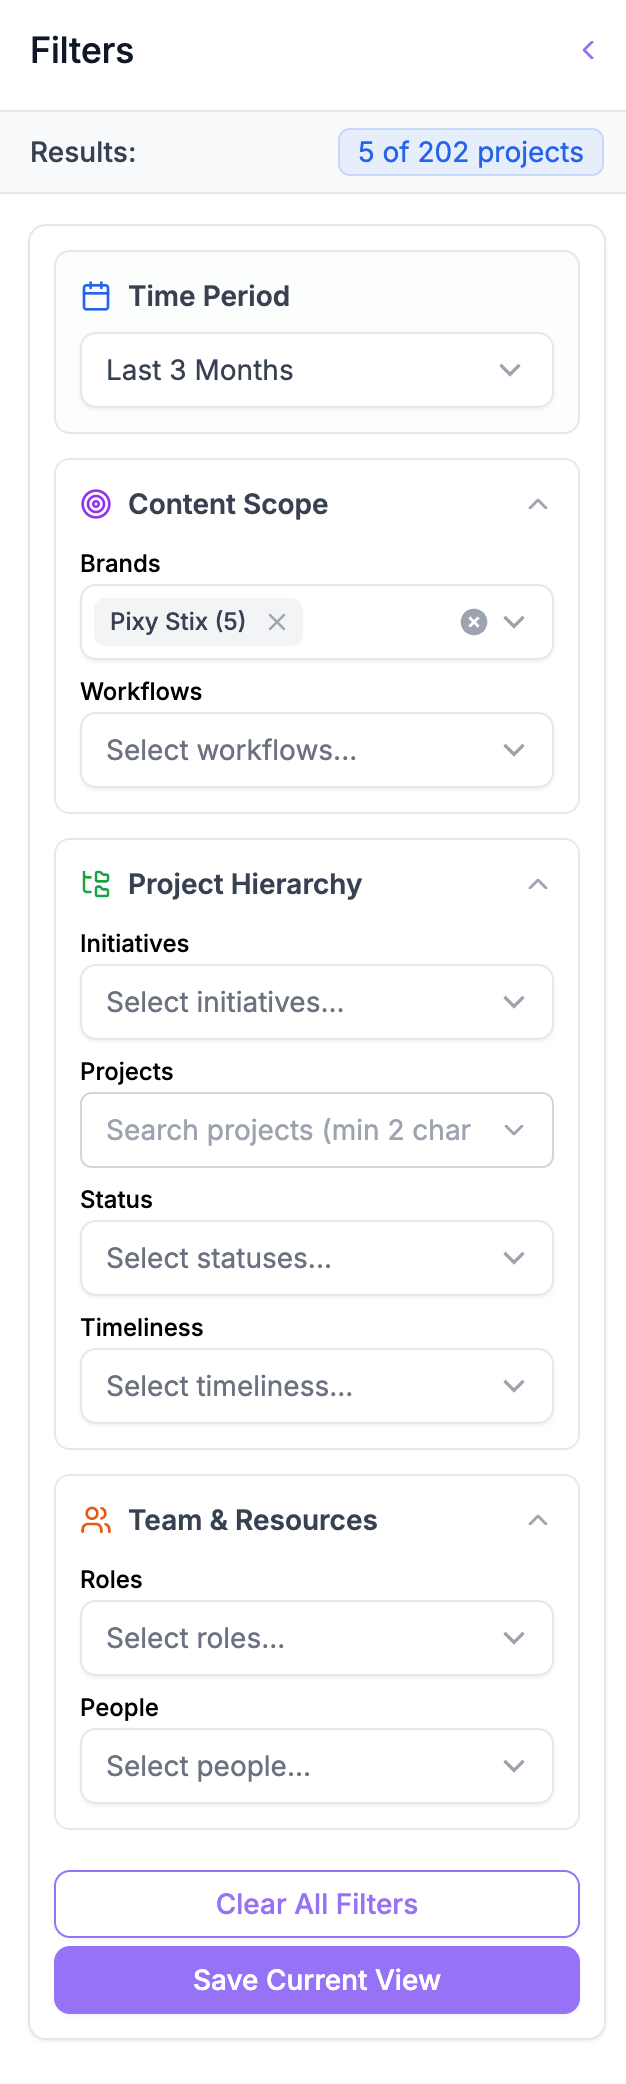
The dashboard makes it possible to combine several dimensions at once:
- brands
- workflows
- projects
- initiatives
- time periods
- roles
- users
- on-time delivery
- task types
Users can therefore explore complex questions quickly, without depending on a data team or bespoke technical queries.
10 analysis axes combinable in real time
Filters are dynamic and let users build precise analyses in a few clicks.
Faster, better-informed decisions
The dashboard notably enables:
- leadership to steer improvement priorities;
- project managers to anticipate slippage;
- team leads to spot workload imbalances;
- quality managers to measure the real impact of corrective actions.
“ Process improvement becomes measurable”
A structured product and methodological approach
The project was designed from business needs formalised directly with the platform's users.
Capamoon adopted a “spec-driven” approach to precisely define KPIs, business rules, expected behaviours and data models before any development started.
AI was used intensively to accelerate design and structuring phases while maintaining a high level of consistency and quality.
Spec-Driven Development
Capamoon relied on Spec Kit (GitHub) to structure functional specifications, data models, API contracts and implementation plans ahead of development.
An architecture built for interactive analysis
The dashboard relies on a modern architecture enabling:
- interactive visualisations
- real-time filtering
- smooth navigation through complex multi-dimensional analyses
Capamoon notably leverages modern technology components (React, Tremor, …) to deliver a fast, maintainable and scalable analytical experience.
Results & next steps
In just two weeks, Capamoon designed a full prototype of MyMediaConnect's analytical dashboard.
The prototype was presented to end users and received very positive feedback on:
- the readability of the analyses
- the depth of cross-analyses
- the ability to quickly identify friction points
- the consolidated view of operational performance
The project also lays the foundations for a gradual rationalisation of the platform's legacy dashboards and reporting logic.
Finally, the architecture and methodology put in place allow MyMediaConnect to confidently consider the next steps:
- connection to real data
- new KPIs
- richer analyses
- large-scale rollout
“Beyond the prototype itself, the project shows how an approach combining product expertise, business understanding and modern development practices can dramatically accelerate the creation of analytical tools with strong strategic value.”